
Taking on the Stack Overflow data dump: Analysis & Predicitons

There’s no denying the fact that if not for Stack Overflow, lots of our queries - ‘How do I align a picture in CSS’, ‘How to pickel a file’, ‘How to add camera button to my app’ and many others - would go unanswered. It’s parent website, Stack Exchange, is an online programming Q&A web site that allows people to ask questions on not only the Geeky topics of programming, but also on common agendas as cooking, and movies.
The website’s data dump has always been a popular among both Grad students and researchers alike as it provides them an opportunity to analyze common trends, and maybe some other spooky experiment of theirs.
I’ve always wanted to learn about Data Science, hence, I decided to put on my learning hat and choose this very humongous for the purpose. So, enough ramblings, let’s talk business.
In this post, I will discuss the whole process I went through to get these results. All of my code is available at my Github repository .
Tools of trade
“Man is a tool-using animal. Without tools he is nothing, with tools he is all” - Thomas Carlyle
Therefore, I used the following tools:
Getting the data & Pre-processing
The Stack Exchange Data is a huge one, ~ 200 GB. I downloaded it from this link. This data dump contains all queries, except for those deleted or met some other fate, from 2008 till date. Now, I fed the data into MySQL for easy manipulation, because - you know - I’m lazy, and ran some queries to get the hang of it. Then I went on to install MySQL connector for easy access of database from my python.
Some points that I noted:
-
Use the
--local-data-infileflag while logging into MySQL server. Without it, you’ll get some pesky errors while importing and exporting files from your local machine. -
It is wise to convert MySQL tables into CSV when you need large amounts of data, of the order of a few million rows; improves speed.
-
It is good to just export files from MySQL to
/var/Mysql/and then using root to transfer the file wherever you want , than trying to change the default export folder. At times, as in my case, all attempts as trying to change the directory might fail.
Alternatively, Stack Exchange now has its own online database query system, where you get to enter SQL-like queries and download a CSV file right away. Key to using this: Download data in chunks.
Now, with my data correctly formatted :
Time for some Analysis
First, taking the Viewcount from table Tags and plotting for most used tags, the graph looks something like this:

Moreover, the top 10% tags account for more than 80% of the questions on Stack Overflow.
Moving further! Upon formating the data from Posts into Pandas Dataframe, I see that there are more than one tags for most of the questions. This can be used to generate some interesting visualisations. Determining the co-occurence pairs is a very tedious task, so I take the top 200 tags for the task.
Now, I made a degression to study about Graph Theory. But why?
Graphs are mathematical structures used to study pairwise relation between objects, so , I use Networkx, a Python package for creation and manipulation of dynamic structure to generate an undirected graph data contiguous to the DataFrame, with Lanuage names as Nodes and number of co-occurences between then as weights.
It is a good idea to check the generated graph data for any self-looping nodes.
The number of (Node,Node) pairs is very large so, but most of them will have not depict any specific relationship. Hence, I took only the top 20 tags and fed them to Gephi. Tweaking the settings for a while gave me something like this:
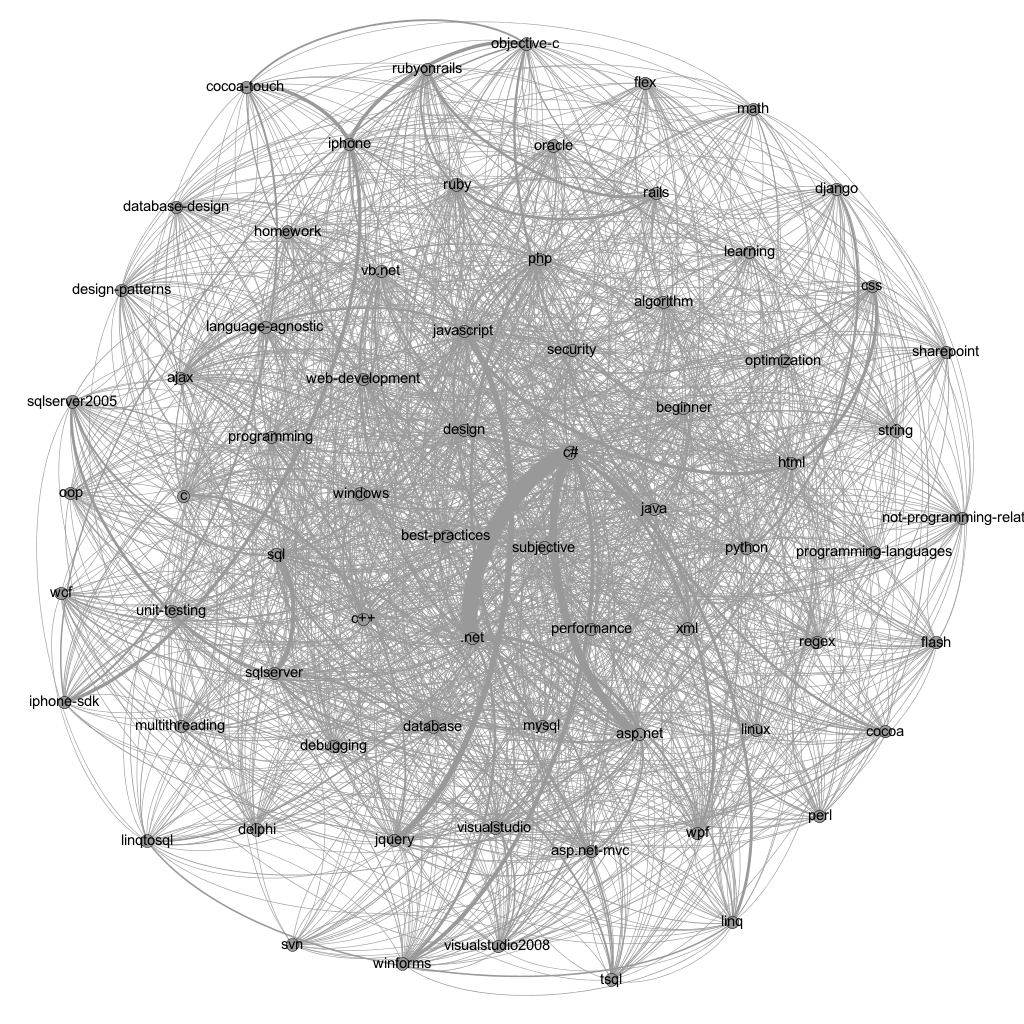
I got the inspiration of this design from another image I saw online
The above graph shows a strong relation between C# and .net **, **C# and asp.net and a connection between html and css, iphone and iphone-sdk and a few others.
But I don’t want to throw away the generated graph database. Bokeh, again, comes to the rescue.
Below is an interactive heatmap of 80 tag-pairs.
One fact is discernible the moment we look at the plot: Most of the tags have no occurences when comapred to that of big names in the chart. Hmm…. A strange correlation with the Wealth distribution in the World.
Once again, I find that, since all questions are associated with their respective creation dates, another plot can be made to see how the trends in language usage has changed over the years. But,how must I plot this . . . ?

For an analysis over the years, what could be better than the Gapminder. Don’t forget to play with the slider.
The rise and fall of different programming languages over the years is evident from the plot,most obviously the fall of PHP and the rise of Javascript and Python.
Axis values in the graph are completely random and only used to position the bubbles.
Equipped with some idea of what’s happening inside those large tables of data, it is time for some predictions.
Score Prediction using Scikit-Learn
Score Prediction
Answers are judged for their accuracy by the scores they get. A high score resembles a good answer and vice-versa. To predict scores, a model is trained on answers and scores as labels. I used 1.5 million answers as test data and 0.5 million answers as test data.
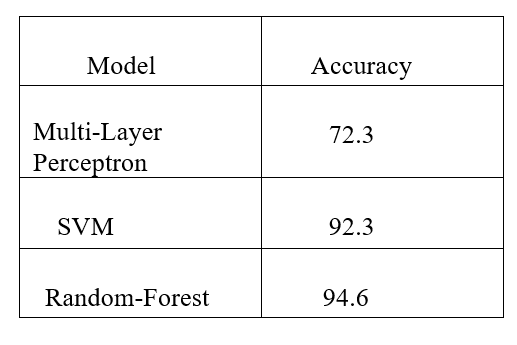
All the answers were used as it is only removing the opening and closing braces. I, then , make a Tf-Idf vectorizer pipeline to create a Bag-of Words representation and then feed it into a classification model. I created the whole prediction problem into a classification process by diving the whole Score range into 4 distinct groups as score < 0, 0 < score < 499, 500< score < 999 , and score>1000.
Below is a table of the classification models and their respective accuracy:
Tag Prediction
Now this is the real beast. I started by doing a test-train split, with initially keeping 1 million questions in my test set and 200,000 questions in my test set. Simply, feeding this into our go-to Scikit- Learn models provided very deplorable results.
Then, I went surfing on the internet and found a real gem - fasttext, a Word Representation package by Facebook. It has a very straight-forward schematic; the best this of all - you do not need to go through preparing a Word Representation using Tf-Idf Vectorizer.
Although, this is a plus, fasttext takes in input as a text file arranges in the order of one data point per line separated by a label prefix and the corresponding label.
After some pre-processing, my data looked like this:
How to use fasttext for text classification in Python? _label-prefix_ Python
Now, I was ready to give predicting a shot.
Fasttext has a range of functionalities, but the one I used is its Test Classification model that goes something like this:
tag_classfier_model=fasttext.supervised('test_data.txt',model,label_prefix=__prefix__)
This produced two outputs: model.bin and model.vec. Fasttext is fast, like really fast. The first time I used it, my CPU usage spiked for around a few seconds and then it was back to normal, giving me the intuition that it did not work and there’s a problem with my code. But, it was only after checking the bin file that I realised it’s prowess.
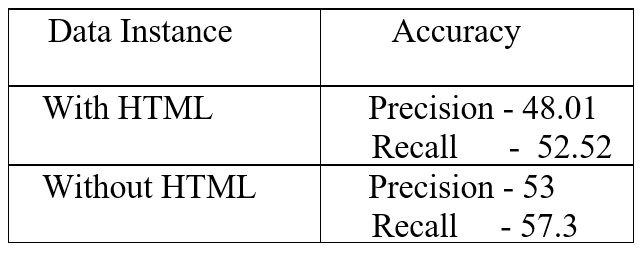
This model was not good enough with only a Precision of 20% and Recall of little over 32%. Time for some more data cleaning. With some reading on Kaggle, other websites and random musings, I removed the <code> tags, gibberish special characters and I made two instances of my data - one with html links embedded in text and the other without. I also increased my dataset to 2 million question and test set to 500,000. Training the model and testing the results gave the following results:
I still have the titles for each question. So, formatting and training a model tuned out to be a better option with giving out 73.09% on precision and 78.36% on recall.
Finally, I use my Validation set, a set of 10,000 questions and 10,000 titles and predicted the best five labels. I also tried to predict labels by feeding titles to my model trained on questions and vice-versa. The results follow in the table below:
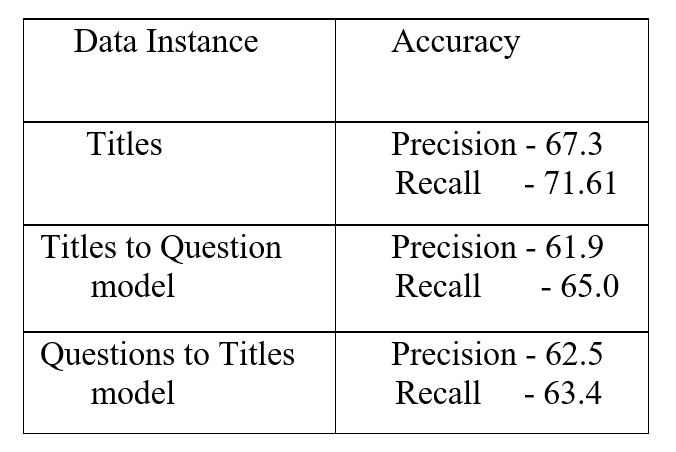
So,it turns out, titles are a better options. I think, mainly this is because titles contain outright statements mentioning names of programming languages which might help the model make better predictions. Moreover, best models on Kaggle also used a dataset that used both titles and questions in a sophisticated manner.
Conclusion & Beyond
So, In the END

The Stack Overflow data dump is a really profound dataset, a collection of human activities and queries. I believe I’ve barely scratched the surface on what can be done with this data. I have more questions that this data set can answer - what time does the website see the most activity, which programming language is used most for a certain task, how credible is an answer and many more. Further, I wonder if we can train a bot on the data to answer questions and also provide code examples, because we have seen Neural Network’s ability to learn the basic rules of programming like indentation, variable assignment etc. and with novel approaches like One-shot learning, maybe they can learn the right way to blurt out code.
The possibilites are endless, so, let’s keep out learning hats on and use the tools available to create something MAGICAL.